New features in this version:
- In-cells charts as cell formats. With one click you can create any number of mini-charts displayed in cells.
All parameters and display options are set up automatically. The number of in-cell charts is practically unlimited and doesn’t affect the workbook performance. The max. size of a data series is the same as the max. number of worksheet rows: 12 millions. To change the color, set the font color for a given cell.
By default, you apply this in-cell format to a cell(s) at the end of a data series placed in a row. However, the chart(s) can be also displayed at the beginning of a series in a row or above or below a series in a column - a plain cell text alignment determines this: - The Format > In-Cells Chart menu:
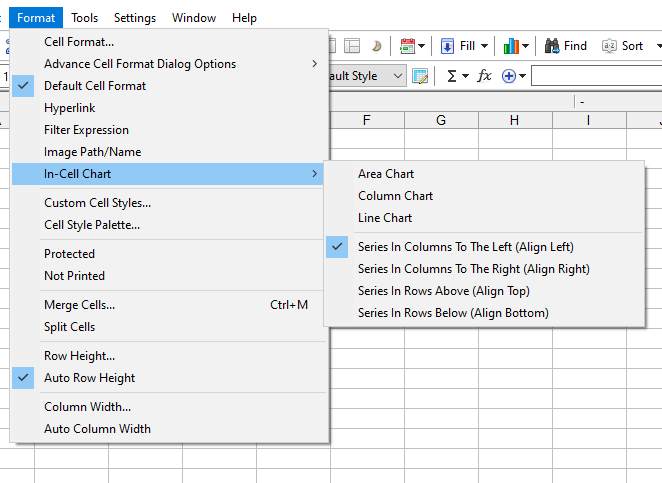
https://citadel5.com/help/gscalc/in-cell_chart1.png
- Sample in-cell charts:

https://citadel5.com/help/gscalc/in-cell_chart3.png
March 22, 2023 - 18.7.1 Update
- A bug fix: when saving PDF’s in-cell line charts were saved as bar charts.